
A bowtie diagram is a risk management tool that visualises risks in an understandable way.
Go here to explore how to create your own bowtie tool: openrisk.presight.com
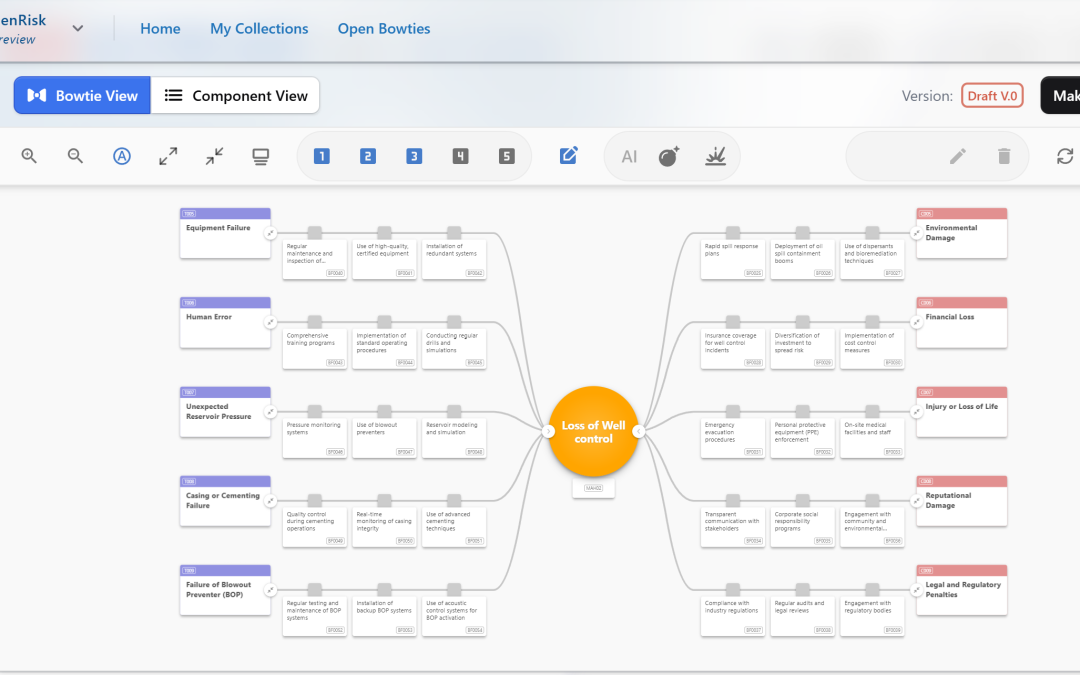
The diagram is shaped like a “bow tie”. A bowtie analysis is used as a risk management or barrier management tool by visually mapping out the relationships between potential threats, a central event (the top event), and the resulting consequences. This method incorporates preventive measures to stop threats from causing the main event and mitigating measures to reduce the impact of these consequences. By illustrating how different elements of risk interact, the bowtie methodology provides a comprehensive and understandable way to manage complex risk scenarios in one single view.
What is a top event?
Before you can define your top event for your bowtie analysis, you must define your hazards. A hazard is something that can cause harm to people, the environment, or assets. For example, an explosion or fire that can endanger workers on the rig and the environment
Once the hazards in your organisation have been identified and defined, you can now identify what your top event is. The top event is the “event” that happens just before the actual damage occurs. In the case of a fire or explosion, the top event could be a subsea blowout of crude oil or natural gas from an oil and gas well after pressure control systems and equipment have failed.
The more specific the top event, the more effective the bowtie diagram will be. The top event is positioned in the middle of the bowtie.
Escalation Factors
The conditions that can reduce the effectiveness of a barrier such as corrosion in a pressure valve would be an escalation factor. With the ocurance of a threat the barrier would fail escalating the situation. These Escalation factors create the holes in the Swiss Cheese Model (SCM) of James Reason.
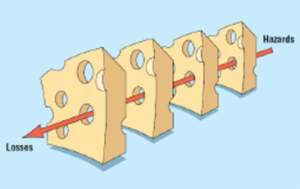
Larouzee J., Le Coze., Good and bad reasons: The Swiss cheese model and its critics.
Threats
Consequences

Preventative and recovery barriers
Now you have a clear risk picture of the hazard, top event, threats, and consequences. For the next part, you need to define your barriers to control the unwanted scenarios. On the left side of the bowtie, barriers are the preventative barriers that will prevent the top event from happening. On the right side of the bowtie model, there are the recovery barriers to minimize the top event, so the scenario does not escalate once the top event has occurred.
Technical, organisational and Operational factors (People, Plant and Process)
Once you have your preventative and recovery barriers, each barrier will have a combination of varied factors such as technical or human factors comprising operational and organisational factors.
For each barrier to be effective, it needs to function independently of other controls and be auditable through regular reviews to ensure its functionality remains intact.
With a management system such as the Presight OpenRisk bowtie software tool, allows you to maintain and see the status of your barriers in near “real-time” to assess their effectiveness and functionality at any given point. Additionally, you can assign metadata to the barriers by industry.
This allows the bowtie to become dynamic so “if new data becomes available, this should be used to accurately reflect current status”.. and in return a bowtie can be “dynamic risk assessment by monitoring events in real time (A. de Ruiter, F. Guldenmund/Safety Science 88 (2016) 211-218.)
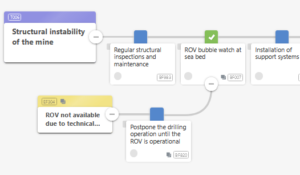
Presight Bowtie Workbench showing green status
Why use bowtie analysis as your risk management and barrier management tool?
Bowtie analysis is a method for visualising your risk assessment focusing on preventing and mitigating your major accident hazards.
Adopting these guidelines ensures that Bowtie diagrams not only fulfil regulatory expectations, but also genuinely contribute to the safety and security of operations. By focusing on the quality and functionality of barriers, organisations can better manage their process safety risks, leading to safer operational environments.
Presight OpenRisk is a risk assessment software tool that visualises complex risks in an understandable diagram. The advantage of using a tool such as “https://openrisk.presight.com/” Presight OpenRisk is the ability to show different degrees of detail in a quick and easy way, from a simple overview to a more detailed view with a massive amount of data. This allows the bowtie to meet the needs of different user groups such as plant managers, operations supervisors, process safety professionals, front-line operators, and maintenance technicians.
If you want to get started with making bowtie’s use our free software tool Presight OpenRisk by clicking here: “https://openrisk.presight.com/”
References
“https://www.icheme.org/media/15543/poster-09.pdf”>Standardisation of Bowtie Methodology and terminology via CCPS/EI Book https://www.icheme.org/media/15543/poster-09.pdf”
Zuijderduijn, C., 1999. Risk management by shell Pernis, the netherland refinery chemicals. In Proceedings of the Seveno 2000 European Conference.
Larouzee J., Le Coze., Good and bad reasons: The Swiss cheese model and its critics. Safety Science Vol. 126, June 2020, 104660
A.de.Ruijter, F. Guldenmund. 2014- The bowtie method: A Review. Safety Science 88 (2016) 2011-2018