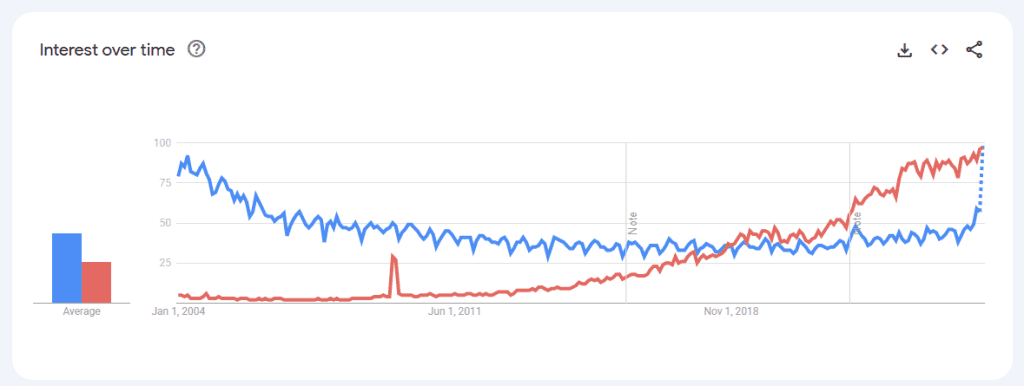
With virtually all industries having undergone some form of digitalisation, cybersecurity has become more pertinent than ever. The relevance of cybersecurity is also reflected in Google searches. The search term ‘Risk management’ remained steady over the years, but around 2022, a noticeable gap emerged between cybersecurity and risk management, with an increasing number of people searching for cybersecurity-related terms.

What is Cybersecurity Management?
Cybersecurity management is the systematic approach to protecting your organisation’s digital assets through coordinated policies, procedures, and controls.
An effective cybersecurity management system answers five critical questions:
- What could go wrong? (Threat identification)
- How bad could it get? (Impact assessment)
- What’s stopping it? (Barrier management)
- How do we know it’s working? (Performance monitoring)
- How do we keep improving? (Continuous enhancement)
This follows the Plan-Do-Check-Act (PDCA) cycle that transforms cybersecurity from a one-time project into an embedded organisational capability. You need to plan your defences, implement them effectively, continuously check they’re working, and act on lessons learned. Without this systematic approach, even the best security tools become outdated defences that provide false confidence.
Building Your Cybersecurity Management System: A step-by-step approach
Step 1: Map Your Digital Assets and Infrastructure
Start with what matters most. Document your:
- Critical data repositories and databases
- Customer-facing systems and applications
- Network infrastructure and cloud services
- Access control systems and authentication methods
- Third-party connections and integrations
- Physical and virtual devices (servers, workstations, laptops, mobile devices, IoT devices)
Step 2: Build a risk register
Create a structured risk register that captures all essential information for each identified risk. It functions as the backbone for your risk management. It is therefore important that it is comprehensive and that it is established by incorporating the insights of all stakeholders.
For now, we are focusing on just cybersecurity. But cybersecurity risk management should not be studied in isolation. The identified risks also impact other aspects under the umbrella of enterprise risk management, such as the organisation’s reputation.
| Hazard | Asset | Event | Probability or Effort | Consequence | Severity | Strengths of Knowledge | Comment |
| Power Disruption | Server | Local blackout (<1 hour) | 5% – 10% | Downtime, operational delays, data loss | Medium | Low | Limited historical incident data |
| Weak Access Controls | Customer Data | Data breach via compromised credentials | 15% – 25% | Regulatory fines, reputational damage, customer loss | High | Medium | Supported by industry trends |
| Weak Access Controls | Business Data | Insider threat (unauthorised data access) | 5% – 10% | Regulatory fines, reputational damage, legal liability | Medium | Low | Limited internal reporting |
| Software Vulnerabilities | Application Data | Web application attack (SQL injection, XSS) | 20% – 35% | Regulatory fines, reputational damage, customer loss | High | Medium | Informed by vulnerability assessments |
| Software Vulnerabilities | Source Code & Software | Intellectual property theft via code exfiltration | 5% – 10% | Competitive disadvantage, financial loss | Medium | Low | Few internal incidents |
Key Components Explained:
- Hazard: Source of harm
- Asset: What’s at risk (systems, data, infrastructure)
- Event: The specific incident that could occur
- Probability: Likelihood range based on available data
- Consequence: Business impacts if the event occurs
- Severity: Intensity of the negative consequences
- Strengths of Knowledge: The knowledge available to the risk assessor for determining the consequences and probabilities
- Comment: Additional information
Step 3: Creating Decision Support
The risk register is the starting point for providing decision support. In this step, the risk manager must balance the need to provide comprehensive information to decision-makers without overwhelming them with excessive details.
Probability Consequence Diagram
Several tools can be used to provide relevant insights without overwhelming the reader. A first step would be to make a consequence probability diagram (PCD) that summarises the findings of the risk matrix. A PCD can take the form of a risk matrix, which is a common tool in risk management. However, the risk matrix is rarely effective as decision support, as it oversimplifies the risk landscape to the point where it leads to worse decisions than if the matrix had not been used.
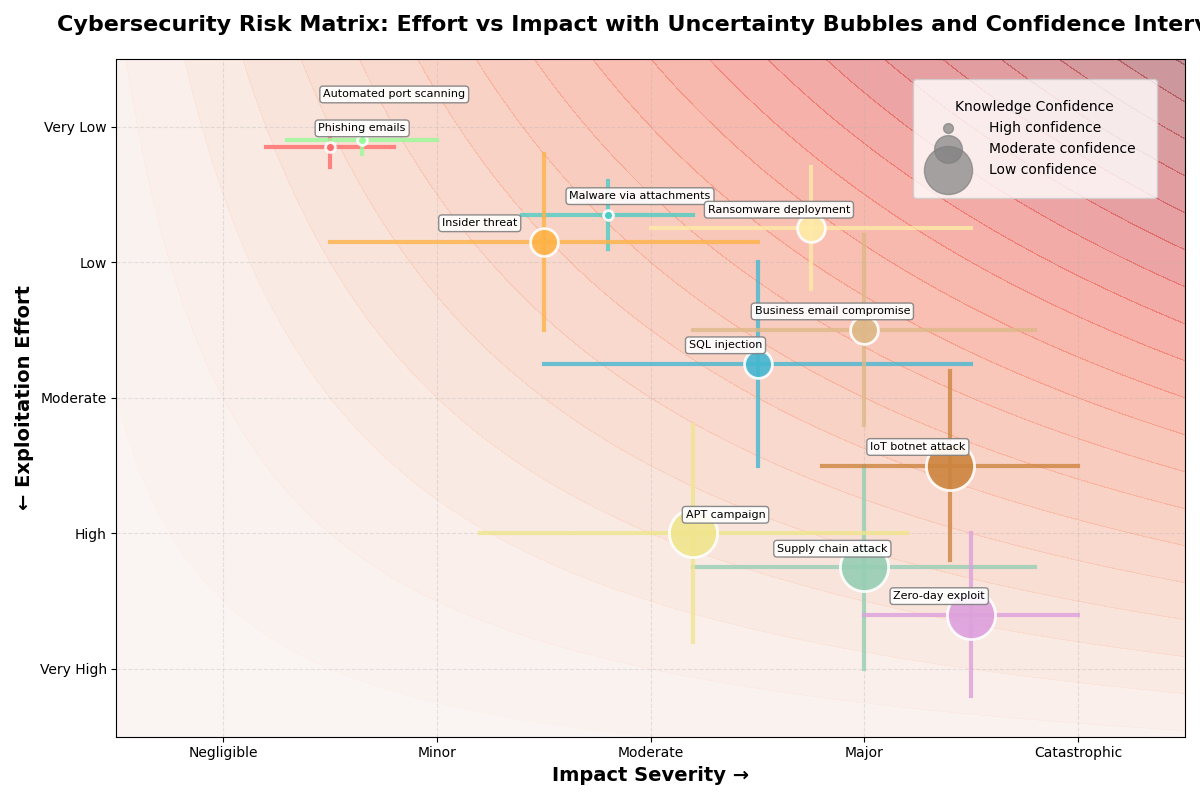
Especially for cybersecurity risks, the traditional risk matrix is insufficient. However, it is possible to create a risk matrix adaptation that provides more information, thereby increasing the likelihood of offering adequate decision support. The go-to adaptation for this would be a bubble diagram with confidence intervals.
The bubble diagram not only represents the consequences and probabilities, but also shows the level of Strength of Knowledge (SoK). This represents the level of knowledge the risk assessor has for determining the probabilities and consequences.

Bowtie Analysis
Bowtie analysis provides a framework that maps the complete risk scenario, showing how multiple threat pathways can lead to system compromise and identifying the barriers that stand in the way.
Making bowties of the risk events from the risk register can be a great way to provide decision support. Using tools such as Presight OpenRisk can provide a comprehensive, yet easy-to-understand overview of the causes and effects of a central event. And most importantly, what preventive and mitigating strategies can be employed to minimise the risk.
Figure 1 Embed from Openrisk
Step 4: Decide and Do
After analysing the risks and turning this into decision support, it is time to decide and act on these decisions. We can avoid risk by stopping certain activities. We can reduce risk by implementing barriers, or accept the risk or share it through insurance.
Step 5: Check – Monitor and Measure Performance
A cybersecurity management system is only as good as its ongoing performance, so this stage is about measuring whether your system works as intended. Start by monitoring the effectiveness of the barriers. For preventive measures, that might mean tracking patch compliance, multi-factor authentication adoption, and training completion rates. For mitigating barriers, track how quickly threats are identified and contained, the accuracy of your monitoring tools, the reliability of your systems, and whether recovery measures such as backups succeed when needed.
Barrier status alone is not enough; they need to be tested. Run penetration tests to simulate attacks, stage phishing exercises to gauge employee readiness, and rehearse disaster recovery plans to ensure resilience. Red team exercises can provide a realistic picture of how well your organisation performs under pressure.
Finally, review the entire management system through regular audits to ensure its effectiveness. Internal audits should check your internal processes and barriers. External audits offer an independent assessment, while compliance audits verify that you’re meeting regulatory requirements such as ISO 27001 or NIST. This constant cycle of measurement, testing, and review ensures that your defences don’t become stale or overestimated.
Step 6: Act
Once you’ve identified what works, the next step is to lock those successes into your organisation’s daily operations. Standardise proven solutions by converting effective pilots into formal procedures, updating policies to match best practices, and formalising any ad-hoc processes that have shown real value. Lessons learned from incidents should feed directly into training programmes so the knowledge isn’t lost.
Embedding these improvements into the organisational structure is equally important. That can involve updating job descriptions to include security responsibilities, adjusting performance metrics to reward secure behaviour, and incorporating security checkpoints into existing business processes, such as procurement and vendor management.
You also want to consolidate improvements, removing redundant or conflicting controls and harmonising security practices across all departments. Over time, these efforts should lead to a unified set of security standards that everyone follows.
When the dust settles, document what has been standardised and set fresh targets for the next cycle. In this way, a foundation is built that stands firm even as people, tools, and threats change.
Conclusion
The PDCA approach we’ve outlined transforms cybersecurity from a reactive scramble into a predictable, manageable business process. By building a risk register, visualising threats through bowties, and continuously measuring barrier effectiveness, you can create clarity in complexity.

