
Presight Barrier Management tool is a critical component to process safety management. In short, the software provides the full risk picture of your assets, whether it is a drilling rig like a jack-up rig, a fixed platform, a semi-sub or even a drill ship. It can also be applied to other assets where preventing and mitigating major accidents is critical. All in all, it provides a clear visual overview and deeper insight into the overall risk picture.
This article will explore the Presight Barrier Management software tool and its capabilities.
The homepage
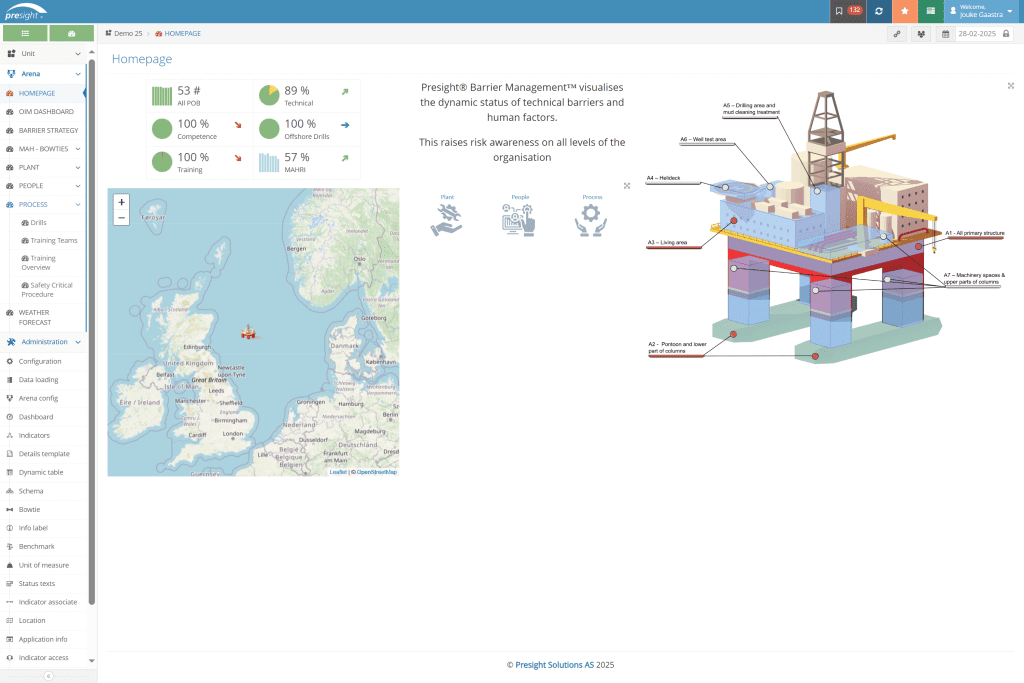
Screenshot of Presight Barrier Management Software showing a typical home page using demo data.
This home page gives a quick overview of your operations. It shows where your asset is, a quick area view of your asset, and the safety conditions related to the area. You can also get an overall overview of your safety critical operations showing key metrics for managing risks on an oil platform. Below these graphs, there is a map indicating the location of the platform. While in the middle of the dashboard, there are three categories with icons that lead to subpages: Plant, People, and Process, or in other words Organisation, Operations, and Technical barriers. These subpages give more in-depth data on the different safety critical barriers and metrics.
On the right side of the dashboard, you can view your asset, and the area view of conditions. This gives a quick area perspective and overview of potential areas that need attention. Each of these areas can be clicked and will lead to the associated Dashboard.
Role specific dashboards
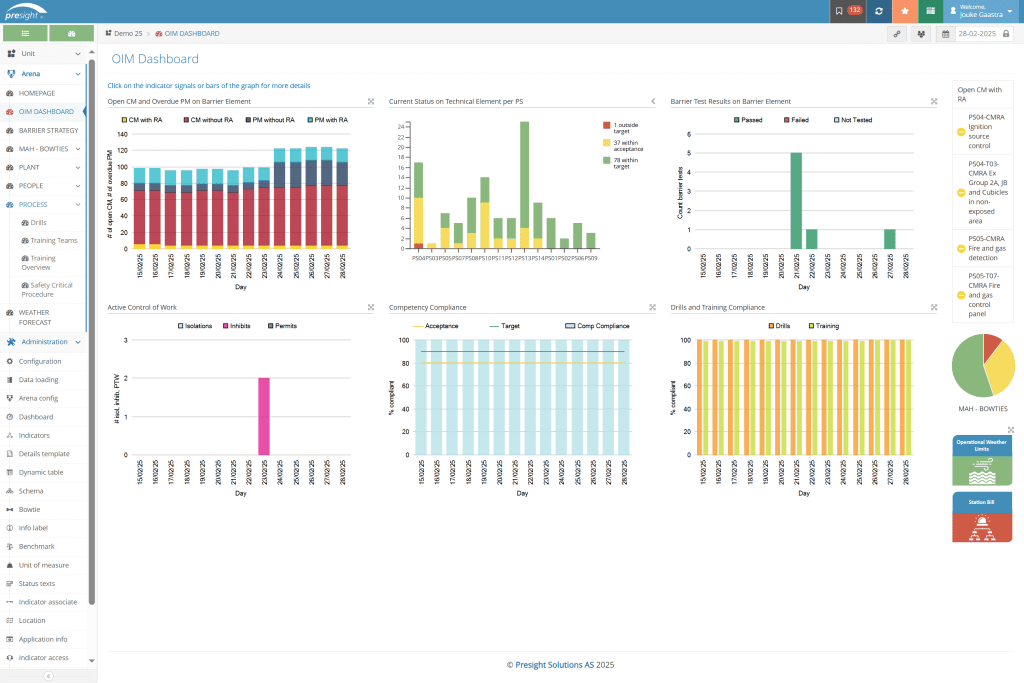
The OIM Dashboard in Presight Barrier Management
Presight Barrier Management can create custom role-based dashboards. In the dashboard above, a customised dashboard has been configured for the Offshore Installation Manager (OIM). It shows a variety of visuals relevant to the OIM role. It displays the status of both technical and personnel indicators. This includes results from barrier tests and records of planned or overdue maintenance.
Each graph is interactive and can be clicked to find the relevant details.
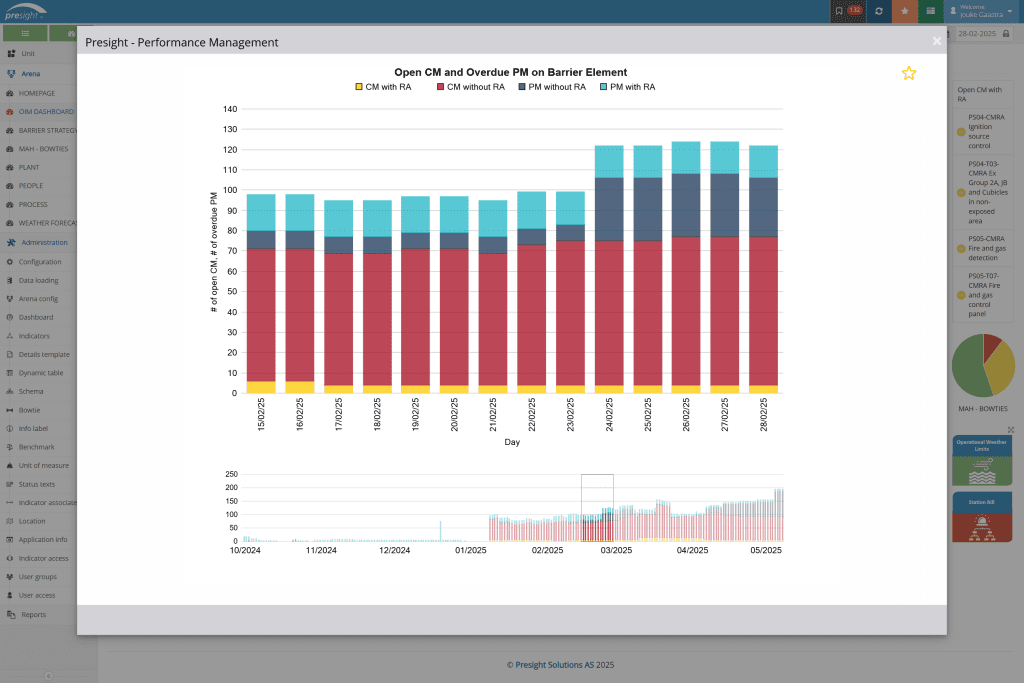
Graph shows Open Corrective Maintenance (CM) and Overdue Preventative Maintenance (PM).
Presight Barrier Management can employ a variety of dashboards with visual representations. Each graph can be expanded from the OIM dashboard to show the status of corrective and planned maintenance on barrier elements.
Presight barrier monitoring can employ a large variety of visual representations. From pie charts to stacked signal charts. Each visual can be expanded and interacted with.
Prognosed data can also be shown, giving the user a clear picture of not only today’s compliance but also future compliance. The graph features a slider at the bottom, enabling users to view past and future events. This can be used for investigative purposes or to inform better decision-making in the future.
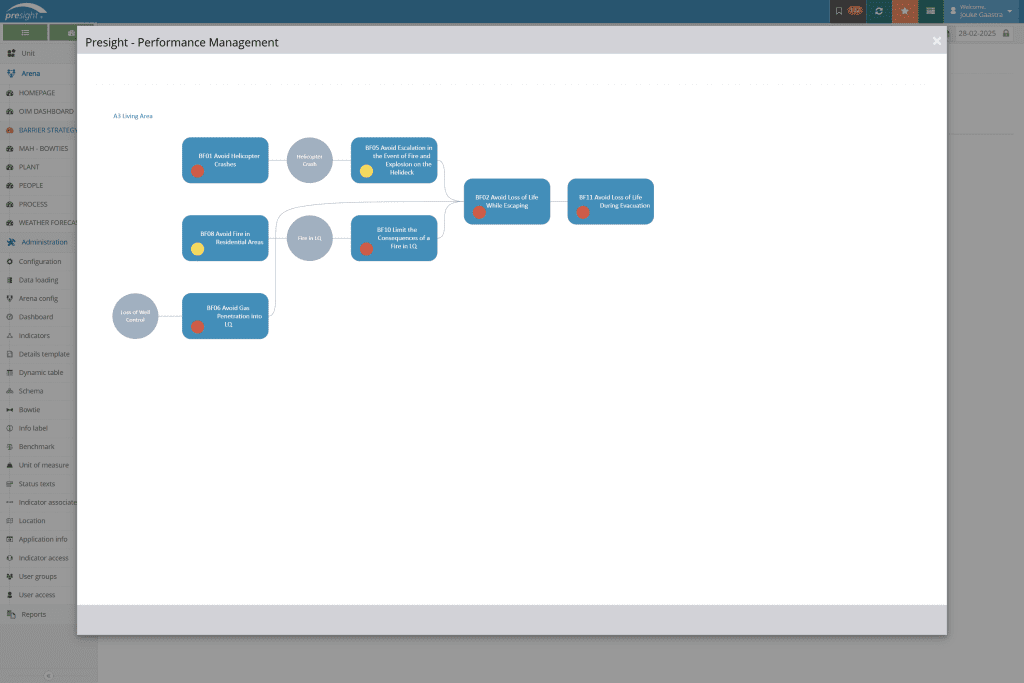
The bowtie dashboard

The Loss of Containment (LoC) bowtie in Presight Barrier Management
The bowties show all the relevant barrier elements for managing the hazardous activity related to the top event. Each barrier element has a status colour, such as green, amber, or red, indicating whether it is compliant or not. Clicking on each barrier element enables a deeper dive into the root cause of the degraded barrier.
The bowtie visualisations are also available as a standalone solution. Presight OpenRisk, a web-based software tool, lets users create and share bowties.
A dashboard of the Barrier grid shows the barrier management strategy with status indicators.
Human Factors in Presight Barrier Management
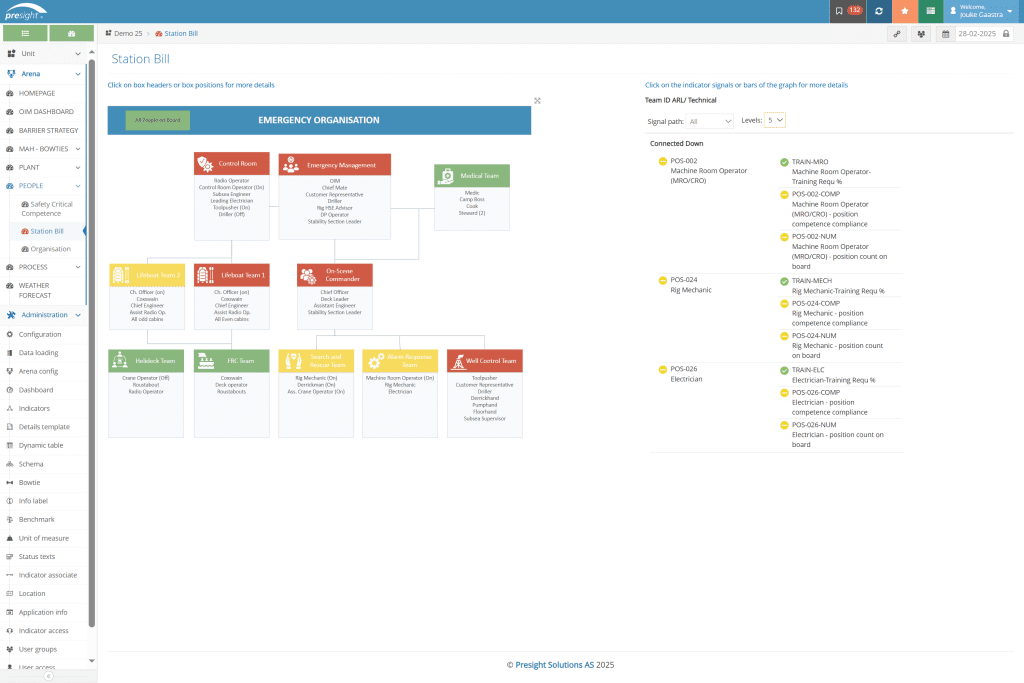
The Station Bill in Presight Barrier Management shows the Emergency Response team.
What makes Presight Barrier Management unique is that it also considers human factors. There are many human factor perspectives, such as the Station Bill, which shows the Emergency Response Team with status and signals attached to each team. Click on each team will allow for more insight and information on the status.
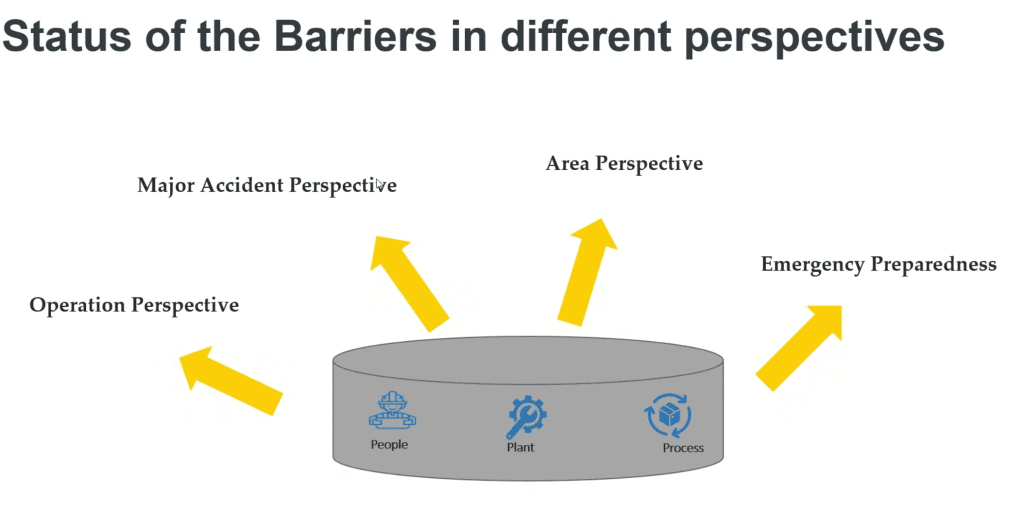
Presight Barrier Management shows a clear and comprehensive view of the risk picture through tailored dashboards and multiple perspectives. It also allows you to drill down into root causes for deeper insight.
If you are interested in learning more, contact us for a demo: Demo – Presight Solutions AS -Click to request a free demo with us.