Published Jun 24, 2025 | Last updated Jul 7, 2025 | News, OpenRisk, Uncategorized
As the oil and gas industry advances with complex operations and technologies, managing the inherent risks associated with loss of stability has become a critical priority. Loss of stability events, such as structural failures, and equipment collapse can lead to...

Published Jun 24, 2025 | Last updated Jul 7, 2025 | News, OpenRisk, Uncategorized
Loss of Well Control (LoWC) is one of the most severe incidents in the oil and gas industry. It refers to situations where the pressure in a well can no longer be managed safely, potentially resulting in blowouts, fires, environmental damage, and loss of life. Causes...

Published Jun 13, 2025 | Last updated Jun 27, 2025 | BM, News
Why uncertainty deserves a spotlight Uncertainty is inherent in safety-critical industries; no data set is ever complete, and Presight openly accepts and highlights this reality. By clearly showing gaps, limitations and variability in the data, the platform lets...

Published Jun 12, 2025 | Last updated Jun 24, 2025 | News, OpenRisk
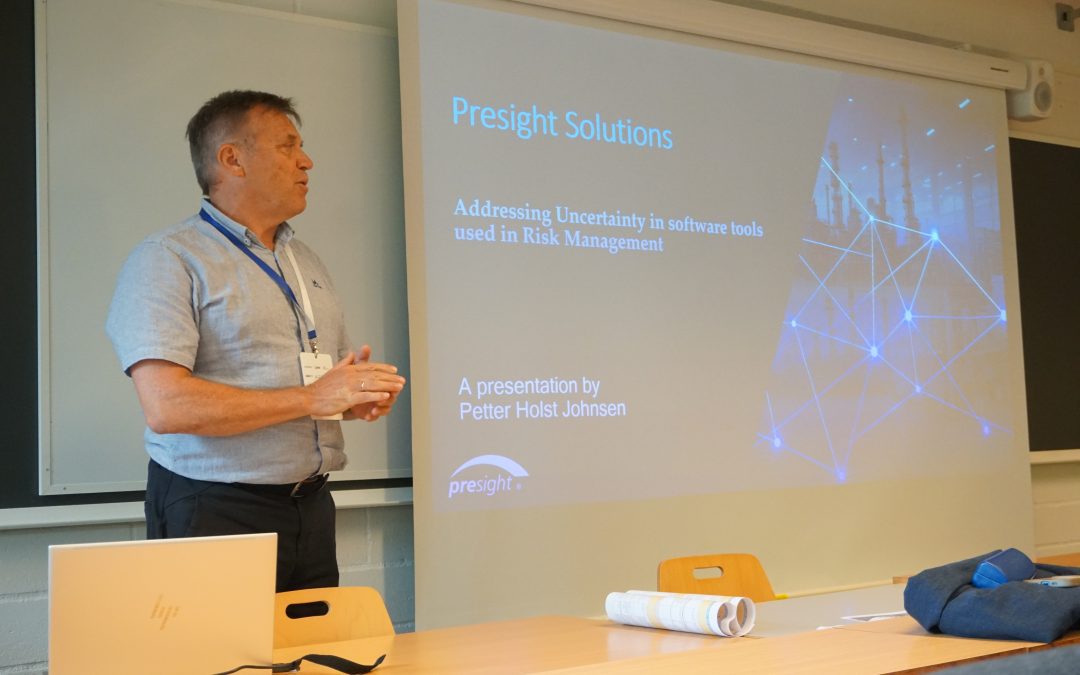
What is the relationship between Artificial Intelligence and risk in high-risk industries like oil and gas? This June at the ESREL and SRA-E 2025 conference hosted by the University of Stavanger, Presight Solutions is proud to lead a panel discussion that unites...

Published Jun 9, 2025 | Last updated Jul 7, 2025 | Mining, News, OpenRisk
The 2010 Chilean Mining Accident In 2010, 33 workers spent 69 days trapped inside the San Jose gold and copper mine after it collapsed on August 5th. The “Chilean mining accident” (2010 Copiapó mining accident) involved a rock fall that triggered a cave-in....

Published Jun 9, 2025 | Last updated Jul 7, 2025 | Mining, News, OpenRisk, Uncategorized
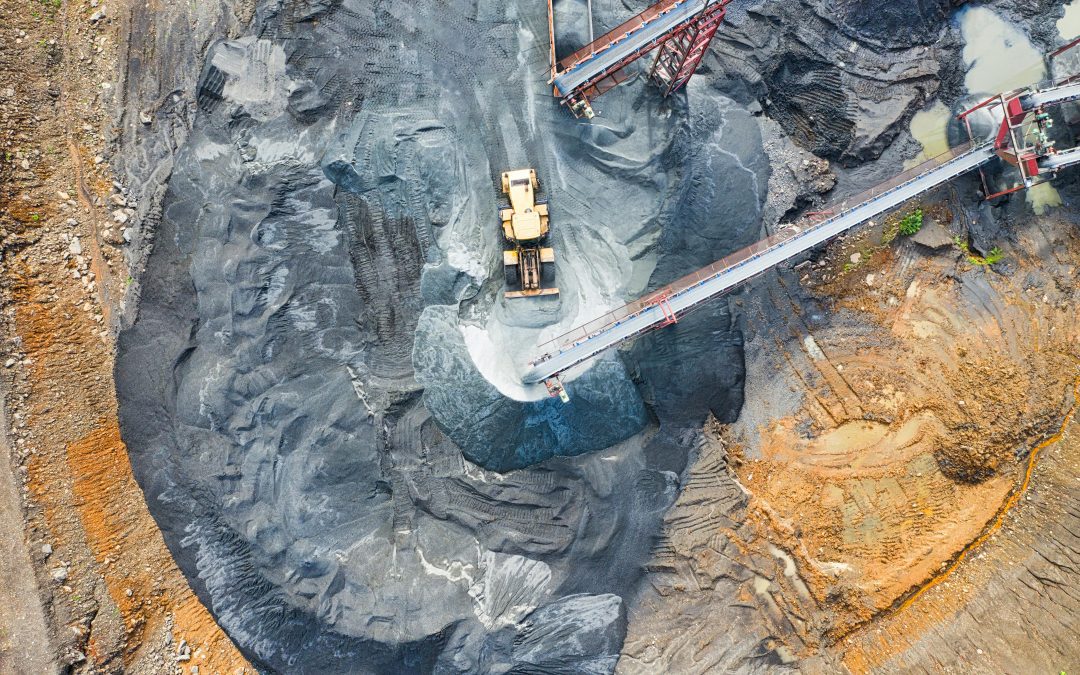
Mining, while essential to the global economy, remains one of the most hazardous industries. Mechanical failures—along with factors like explosions and fires—are a leading cause of mining accidents. This highlights the need for strong safety measures and advanced...


